resquiggle
f5c resquiggle aligns raw signals to basecalled reads. f5c resquiggle output is explained below.
resquiggle TSV output
The default output is an intuitive TSV format with the following columns.
| Col | Type | Name | Description |
|---|---|---|---|
| 1 | string | read_id | Read identifier name |
| 2 | int | kmer_idx | k-mer index on the basecalled read (0-based) |
| 3 | int | start_raw_idx | Raw signal start index for the corresponding k-mer (0-based; BED-like; closed) |
| 4 | int | end_raw_idx | Raw signal end index for the corresponding k-mer (0-based; BED-like; open) |
If a corresponding base has no corresponding signal samples, a . will be printed.
resquiggle PAF output
The above TSV output is bulky. Specifying -c will produce a condensed output in PAF-like format (inspired by UNCALLED) with the following columns:
The query is the raw-signal and the target is the basecalled-read.
| Col | Type | Name | Description |
|---|---|---|---|
| 1 | string | read_id | Read identifier name |
| 2 | int | len_raw_signal | Raw signal length (number of samples) |
| 3 | int | start_raw | Raw signal start index (0-based; BED-like; closed) |
| 4 | int | end_raw | Raw signal end index (0-based; BED-like; open) |
| 5 | char | strand | Relative strand: “+” or “-“ |
| 6 | string | read_id | Same as column 1 |
| 7 | int | len_kmer | base-called sequence length (no. of k-mers) |
| 8 | int | start_kmer | k-mer start index on basecalled sequence (0-based; see note below) |
| 9 | int | end_kmer | k-mer end index on basecalled sequence (0-based; see note below) |
| 10 | int | matches | Number of k-mers matched on basecalled sequence |
| 11 | int | len_block | Same as column 7 |
| 12 | int | mapq | Mapping quality (0-255; 255 for missing) |
For DNA reads, column 8 is a closed coordinate (inclusive) and column 9 is an open coordinate (not-inclusive); and, column 8 coordinate is always smaller than column 9. However, this is different in direct-RNA reads because sequencing of direct-RNA happens in the reverse direction (3’->5’) and therefore the raw signal is also in the reverse direction. The basecalled read output by basecallers are however in the correct direction (5’->3’). Thus, For RNA reads, column 8 coordinate will be larger than that on column 9. column 9 is a closed coordinate (inclusive) while column 8 is an open coordinate (not-inclusive) in this case, in contrary to DNA.
10,11 and 12 are yet to be decided. column 12 is always 255 for now.
Following optional tags are present, which are subsequently described in detail after the table:
| Tag | Type | Description |
|---|---|---|
| sc | f | Post alignment recalibrated scale parameter |
| sh | f | Post alignment recalibrated shift parameter |
| ss | Z | signal alignment string in format |
The sh and sc tag values can be used to scale the raw signal to the pore model. This can be done as: scaled pA current values = (pA - sh) / sc where pA = (raw_signal + offset) * range / digitisation)).
ss tag
ss string is a custom encoding that compacts the signal-base alignment. It can be thought of as an extended version CIGAR string that accommodates for signal alignment needs. This ss string was inspired by the –sam option in Nanopolish for eventalign.
Consider the example 8,5,4,8I4,3D4,5, for DNA. This means 8 signal samples map to the starting base of the sequence; the next 5 samples to the next base, the next 4 samples to the next base; 8 next samples are missing a mapping in the basecalled read (insertion to reference); 4 samples map to the next base; 3 bases in the basecalled read have no corresponding signal samples (deletion); 4 samples map to the next base; and 5 samples map to the next base. Note that the start indexes of read and signal are the absolute values in columns 8 and 3 above. the ss string is relative to this.
The ,, D and I can be though of as three different operations. The , after a number means step one base in the basecall reference, while step number of samples preceding the , in the raw signal. The D after a number means step number of bases preceding the D in the basecalled read and no stepping in the raw signal. The I after a number means step number of samples preceding the I in the raw signal and no stepping in the basecalled read.
DNA Example
To make things further clear, given below is an illustration for an alignment of DNA raw-signal to a basecalled read.
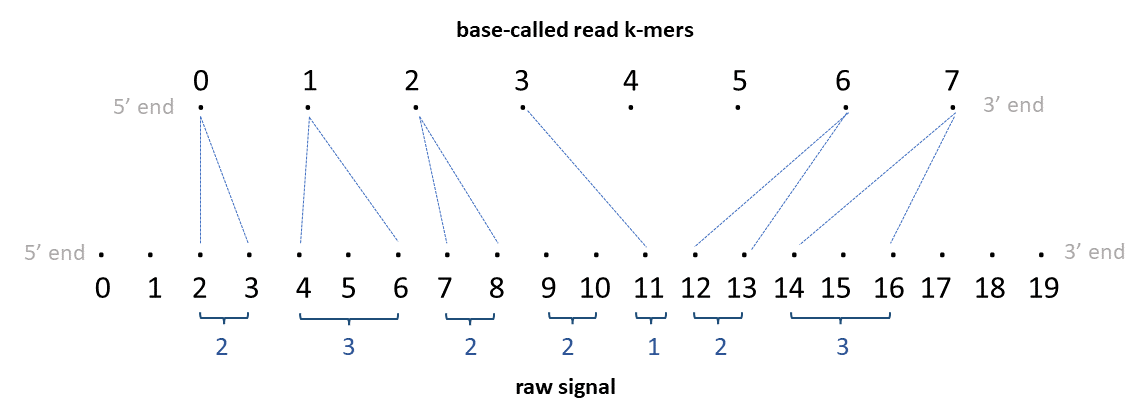
Each dot in the top sequence in the illustration represent a k-mer and the number above each dot is the corresponding k-mer index. If the basecalled read is ACGGTAACTATAC and assuming the k-mer size in the k-mer model is 6, the 0th k-mer is ACGGTA, 1st k-mer is CGGTAA … and the 7th k-mer is CTATAC.
Each dot in the bottom sequence in the illustration represent a raw-signal sample and the number below each dot is the corresponding signal index.
The TSV output from resquiggle will look like below:
| read_id | kmer_idx | start_raw_idx | end_raw_idx |
|---|---|---|---|
| rid0 | 0 | 2 | 4 |
| rid0 | 1 | 4 | 7 |
| rid0 | 2 | 7 | 9 |
| rid0 | 3 | 11 | 12 |
| rid0 | 4 | . | . |
| rid0 | 5 | . | . |
| rid0 | 6 | 12 | 14 |
| rid0 | 7 | 14 | 17 |
The PAF output from resquiggle will look like below (the header is not present in the actual output):
| read_id | len_raw_signal | start_raw | end_raw | strand | read_id | len_kmer | start_kmer | end_kmer | matches | len_block | mapq | |
|---|---|---|---|---|---|---|---|---|---|---|---|---|
| rid0 | 20 | 2 | 17 | + | rid0 | 8 | 0 | 8 | 6 | 8 | 255 | ss:Z:2,3,2,2I1,2D2,3, |
direct-RNA Example
Now see the illustration below for direct-RNA.
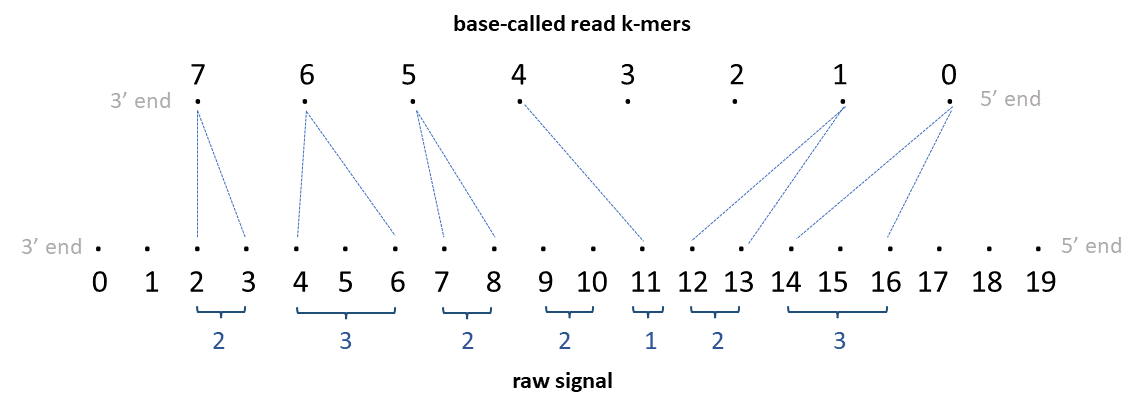
Note that the RNA is sequenced 3’->5’ end, so the raw signal is 3’->5’ direction. As the basecaller outputs the basecalled read in 5’->3’ direction, the basecalled read is reversed to be 3’->5’ in the illustration (note: indices in illustration denote the actual index in the basecalled read in 5’->3’ direction). If the basecalled read in 5’->3’ direction is ACGGUAACUAUA and assuming the k-mer size in the k-mer model is 5, the 0th k-mer is ACGGU, 1st k-mer is CGGUA … and the 7th k-mer is CUAUA.
The TSV output will look like below:
| read_id | kmer_idx | start_raw_idx | end_raw_idx |
|---|---|---|---|
| rid0 | 7 | 2 | 4 |
| rid0 | 6 | 4 | 7 |
| rid0 | 5 | 7 | 9 |
| rid0 | 4 | 11 | 12 |
| rid0 | 3 | . | . |
| rid0 | 2 | . | . |
| rid0 | 1 | 12 | 14 |
| rid0 | 0 | 14 | 17 |
The PAF output will look like below:
| read_id | len_raw_signal | start_raw | end_raw | strand | read_id | len_kmer | start_kmer | end_kmer | matches | len_block | mapq | |
|---|---|---|---|---|---|---|---|---|---|---|---|---|
| rid0 | 20 | 2 | 17 | + | rid0 | 8 | 8 | 0 | 6 | 8 | 255 | ss:Z:2,3,2,2I1,2D2,3, |
C code snippet to parse ss tag
A C code snippet that converts the value in the ss tag (a readable code which is not optimised) is given below:
#include <stdio.h>
#include <stdlib.h>
#include <ctype.h>

#define MAX_LEN_KMER 20000

int main(){

    //paf fields
    char *ss="2,3,2,2I1,2D2,3,";
    int start_raw=2; int end_raw=17; int len_raw_signal=20;
    int start_kmer=0; int end_kmer=8; int len_kmer=8;

    // Raw signal start index for the corresponding k-mer and Raw signal end index for the corresponding k-mer
    int st_raw_idx[MAX_LEN_KMER]; int end_raw_idx[MAX_LEN_KMER];

    //intialise to -1
    for(int i=0; i<MAX_LEN_KMER; i++){ st_raw_idx[i]=end_raw_idx[i]=-1; }

    int st_k = start_kmer; int end_k = end_kmer; //if DNA, start k-kmer index is start_kmer column in paf and end k-kmer index is end_kmer column in paf
    int8_t rna = start_kmer > end_kmer ? 1 : 0; //if RNA start_kmer>end_kmer in paf
    if(rna){ st_k = end_kmer; end_k = start_kmer; } //if RNA, start k-kmer index is end_kmer column in paf and end k-kmer index is start_kmer column in paf

    int i_k = st_k; int i_raw = start_raw; //current k-mer index and current raw signal index

    //buffer for storing digits preceding each operation and its index
    char buff[11]; int i_buff=0;

    while(*ss){

        if(*ss==',' || *ss=='I' || *ss=='D'){
            if(i_buff <= 0){ fprintf(stderr,"Bad ss: Preceding digit missing\n"); exit(1); }//if nothing in buff

            buff[i_buff]=0; //null terminate buff
            int num = atoi(buff);
            if(num < 0){ fprintf(stderr,"Bad ss: Cannot have negative numbers\n"); exit(1); }
            i_buff=0; buff[0]=0; //reset buff

            if(*ss=='I'){ //if an insertion, current raw signal index is incremented by num
                i_raw += num;
            } else if(*ss=='D'){ //if an deletion, current k-mer index is incremented by num
                i_k += num;
            } else if (*ss==','){ //if a mapping, increment accordingly and set raw signal indices for the current k-mer
                end_raw_idx[i_k] = i_raw; i_raw += num;
                st_raw_idx[i_k] = i_raw; i_k++;
            }
        } else {
            if(!isdigit(*ss)){ fprintf(stderr,"Bad ss: A non-digit found when expected a digit\n"); exit(1); }
            buff[i_buff++]=*ss;
        }
        ss++;
    }

    if(i_raw!=end_raw){ fprintf(stderr,"Bad ss: Signal end mismatch\n"); exit(1); } //current raw signal index should be equal to end_raw
    if(i_k!=end_k){ fprintf(stderr,"Bad ss: Kmer end mismatch\n"); exit(1); } //current k-mer index should be equal to end_k

    for(int i=st_k; i<end_k; i++){
        if(end_raw_idx[i]==-1){
            if(st_raw_idx[i] != -1) { fprintf(stderr,"Bad ss: This shoud not have happened\n"); exit(1); }//if st_raw_idx[i] is -1, then end_raw_idx[i] should also be -1
            printf("%d\t.\t.\n", rna ? len_kmer-i-1 : i);
        }else {
            printf("%d\t%d\t%d\n", rna ? len_kmer-i-1 : i, end_raw_idx[i], st_raw_idx[i]);
        }
    }
}
Note that the beginning of the alignment could be crude due to the adaptor and barcode in the raw signal. In future versions, an option for this trimming may be introduced. Until then, if there is a huge step in the alignment in the beginning, that part could be trimmed by the user.
eventalign
eventalign TSV output
The default TSV output is as below:
| Col | Type | Name | Description |
|---|---|---|---|
| 1 | string | contig | Contig on the reference which the read maps to |
| 2 | int | position | Start index on the contig (0-based; BED-like; closed) |
| 3 | string | reference_kmer | The k-mer on the reference |
| 4 | int | read_index | Index in the BAM file for the coresponding read (0-based) |
| 5 | char | strand | Legacy, ignore |
| 6 | int | event_index | Index of the event on the event table (0-based; BED-like; closed) |
| 7 | float | event_level_mean | Mean level of the current values of the event |
| 8 | float | event_stdv | Standard deviation of the current values of the event |
| 9 | float | event_length | Length of the event (in seconds) |
| 10 | int | model_kmer | The k-mer on the pore-model which this event matched |
| 11 | int | model_mean | Scaled mean level on the pore-model for the matched k-mer (scaling.scale * level_mean + scaling.shift) where level_mean in the first column in the pore-model |
| 12 | int | model_stdv | Scaled standard deviation on the pore-model for the matched k-mer (level_stdv * scaling.var) where level_stdv in the second column in the pore-model |
| 13 | int | standardized_level | (event_level_mean - model_mean) / (sqrt(scalings.var) * model_stdv) |
Command line options can be used to modify default columns or print additional columns. --samples will print two additional columns, namely start_idx and end_idx.
Following optional columns are controlled via command line options:
| Command_line_Option | Type | Name | Description |
|---|---|---|---|
--print-read-name |
string | read_name | Column 4 will become read_name that prints the read ID |
--signal-index |
int | start_idx | start_idx is the starting index on the raw signal which the corresponding k-mer maps to (0-based; BED-like; closed) |
--signal-index |
int | end_idx | end_idx is the ending index on the raw signal which the corresponding k-mer maps to (0-based; BED-like; open) |
--scale-events |
float | event_level_mean | Intead of scaling the model to the events, now events will be scaled to the model. column 7 becomes (event_level_mean-scaling.shift)/scaling.scale |
--scale-events |
float | model_mean | Intead of scaling the model to the events, now events will be scaled to the model. column 11 becomes level_mean (level_mean is the first column in the pore model) |
--scale-events |
float | model_stdv | Intead of scaling the model to the events, now events will be scaled to the model. column 12 becomes level_stdv (level_stdv is the second column in the pore model) |
--samples |
float,float,… | samples | Prints the comma separated signal samples corresponding to the mapped k-mer (scaled pA current values). scaled pA current values = (pA - scaling.shift) / scaling.scale where pA = (raw_signal + offset) * range / digitisation |
eventalign PAF output
Specifying -c will generate the output in a PAF-like format (much smaller than the TSV output, f5c v1.3 or higher). This is similar to the PAF output format in f5c resquiggle with major difference being that the “basecalled read” in resquiggle is now the “refererence sequence” in eventalign. Assumming that the reader is well familiarised with the PAF output explained in resquiggle, that information is not repeated here, instead only a summary is given. Unlike in resquiggle, the strand column (column 5) can be now both ‘+’ and ‘-‘. The query is the raw-signal and the target is the reference.
| Col | Type | Name | Description |
|---|---|---|---|
| 1 | string | read_id | Read identifier name |
| 2 | int | len_raw_signal | Raw signal length (number of samples) |
| 3 | int | start_raw | Raw signal start index (0-based; BED-like; closed) |
| 4 | int | end_raw | Raw signal end index (0-based; BED-like; open) |
| 5 | char | strand | Relative strand: “+” or “-“ |
| 6 | string | read_id | Reference sequence name |
| 7 | int | len_kmer | Reference sequence length (no. of k-mers) |
| 8 | int | start_kmer | k-mer start index on reference sequence (0-based; see note below) |
| 9 | int | end_kmer | k-mer end index on sequence sequence (0-based; see note below) |
| 10 | int | matches | Number of k-mers matched on reference sequence |
| 11 | int | len_block | Number of k-mers on the mapped segment on reference sequence |
| 12 | int | mapq | Mapping quality (0-255; 255 for missing) |
For DNA reads, column 8 is a closed coordinate (inclusive) and column 9 is an open coordinate (not-inclusive); and, column 8 coordinate is always smaller than column 9. However, this is different in direct-RNA reads because sequencing of direct-RNA happens in the reverse direction (3’->5’) and therefore the raw signal is also in the reverse direction. The sequences in the reference transcriptome are however in the correct direction (5’->3’). Thus, For RNA reads, column 8 coordinate will be larger than that on column 9. column 9 is a closed coordinate (inclusive) while column 8 is an open coordinate (not-inclusive) in this case, in contrary to DNA.
10,11 and 12 are yet to be decided. column 12 is always 255 for now.
Following optional tags are present, which are subsequently described in detail after the table:
| Tag | Type | Description |
|---|---|---|
| sc | f | Post alignment recalibrated scale parameter |
| sh | f | Post alignment recalibrated shift parameter |
| ss | Z | signal alignment string in format described |
The sh and sc tag values can be used to scale the raw signal to the pore model. This can be done as: scaled pA current values = (pA - sh) / sc where pA = (raw_signal + offset) * range / digitisation)). Please refer to the explanations in f5c resquiggle about the ss tag. Some examples are given below.
DNA examples
Positive strand
Assume we have a read signal named rid0 of 1000 signal samples, mapped to a reference contig named ctg0 of 35 bases Assume a k-mer size of 6. We have a total of 30 k-mers in the reference. Assume the signal-reference alignment looks like in teh figure below. Assume that the 12-24th bases (0-index; bed-like) inthis contig are TTGATGGTGGAA. Thus, 12th kmer is TTGATG, 13th k-mer is TGATGG, 14th k-mer is GATGGT, .. and the 18th k-mer is GTGGAA.
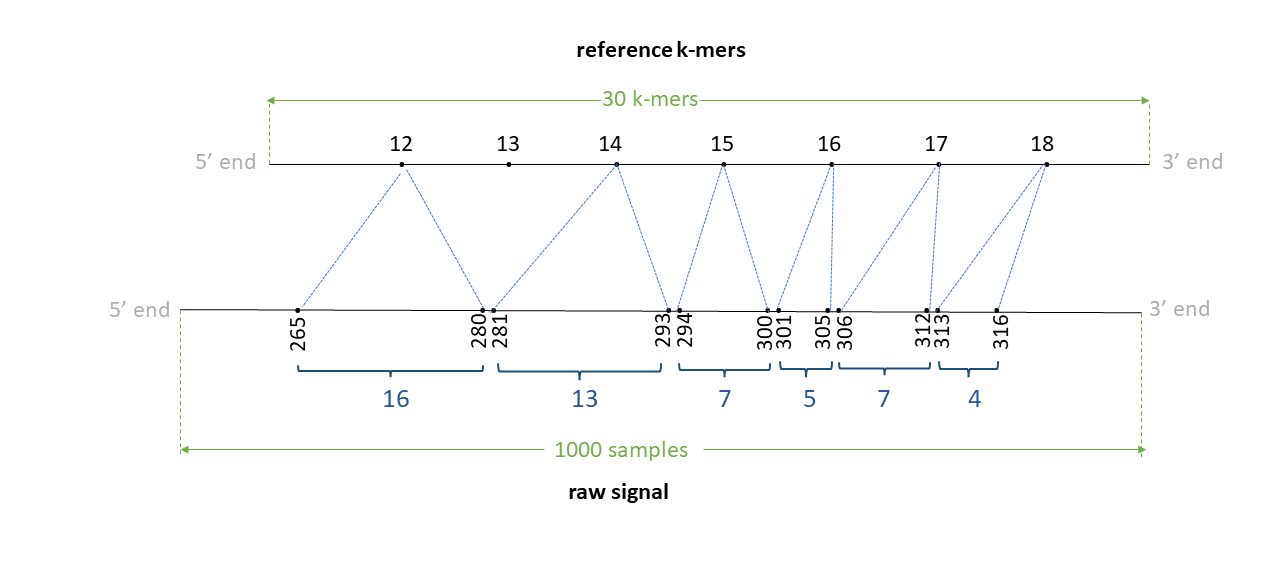
The TSV output from resquiggle will look like below (assume --print-read-name and --signal-index are provided):
| contig | position | reference_kmer | read_id | strand | event_index | event_level_mean | event_stdv | event_length | model_kmer | model_mean | model_stdv | standardized_level | start_idx | end_idx |
|---|---|---|---|---|---|---|---|---|---|---|---|---|---|---|
| ctg0 | 12 | TTGATG | rid0 | t | 50 | 77.39 | 1.226 | 0.00150 | TTGATG | 68.19 | 3.20 | 2.64 | 265 | 271 |
| ctg0 | 12 | TTGATG | rid0 | t | 51 | 85.51 | 1.016 | 0.00125 | NNNNNN | 0.00 | 0.00 | inf | 271 | 276 |
| ctg0 | 12 | TTGATG | rid0 | t | 52 | 87.75 | 1.029 | 0.00125 | NNNNNN | 0.00 | 0.00 | inf | 276 | 281 |
| ctg0 | 14 | GATGGT | rid0 | t | 53 | 94.90 | 1.399 | 0.00100 | GATGGT | 99.32 | 3.48 | -1.17 | 281 | 285 |
| ctg0 | 14 | GATGGT | rid0 | t | 54 | 91.33 | 1.452 | 0.00075 | GATGGT | 99.32 | 3.48 | -2.11 | 285 | 288 |
| ctg0 | 14 | GATGGT | rid0 | t | 55 | 93.10 | 0.863 | 0.00150 | GATGGT | 99.32 | 3.48 | -1.64 | 288 | 294 |
| ctg0 | 15 | ATGGTG | rid0 | t | 56 | 76.79 | 1.980 | 0.00075 | ATGGTG | 76.10 | 4.06 | 0.16 | 294 | 297 |
| ctg0 | 15 | ATGGTG | rid0 | t | 57 | 71.11 | 1.023 | 0.00100 | ATGGTG | 76.10 | 4.06 | -1.13 | 297 | 301 |
| ctg0 | 16 | TGGTGG | rid0 | t | 58 | 63.34 | 3.575 | 0.00125 | TGGTGG | 64.60 | 2.53 | -0.46 | 301 | 306 |
| ctg0 | 17 | GGTGGA | rid0 | t | 59 | 94.76 | 2.090 | 0.00175 | GGTGGA | 94.13 | 3.39 | 0.17 | 306 | 313 |
| ctg0 | 18 | GTGGAA | rid0 | t | 60 | 78.95 | 1.436 | 0.00100 | GTGGAA | 80.55 | 3.83 | -0.38 | 313 | 317 |
The PAF output from eventalign will look like below (the header is not present in the actual output):
| read_id | len_raw_signal | start_raw | end_raw | strand | ref_id | len_kmer | start_kmer | end_kmer | matches | len_block | mapq | |
|---|---|---|---|---|---|---|---|---|---|---|---|---|
| rid0 | 1000 | 265 | 317 | + | ctg0 | 30 | 12 | 19 | 6 | 7 | 255 | ss:Z:16,1D13,7,5,7,4, |
Negative strand
Assume we have a read signal named rid1 of 1000 signal samples, mapped to a reference contig named ctg0 of 35 bases Assume a k-mer size of 6. We have a total of 30 k-mers in the reference. Assume the signal-reference alignment looks like in the figure below (note: indices in illustration denote the actual index in the + strand of the reference genome in 5’->3’ direction).
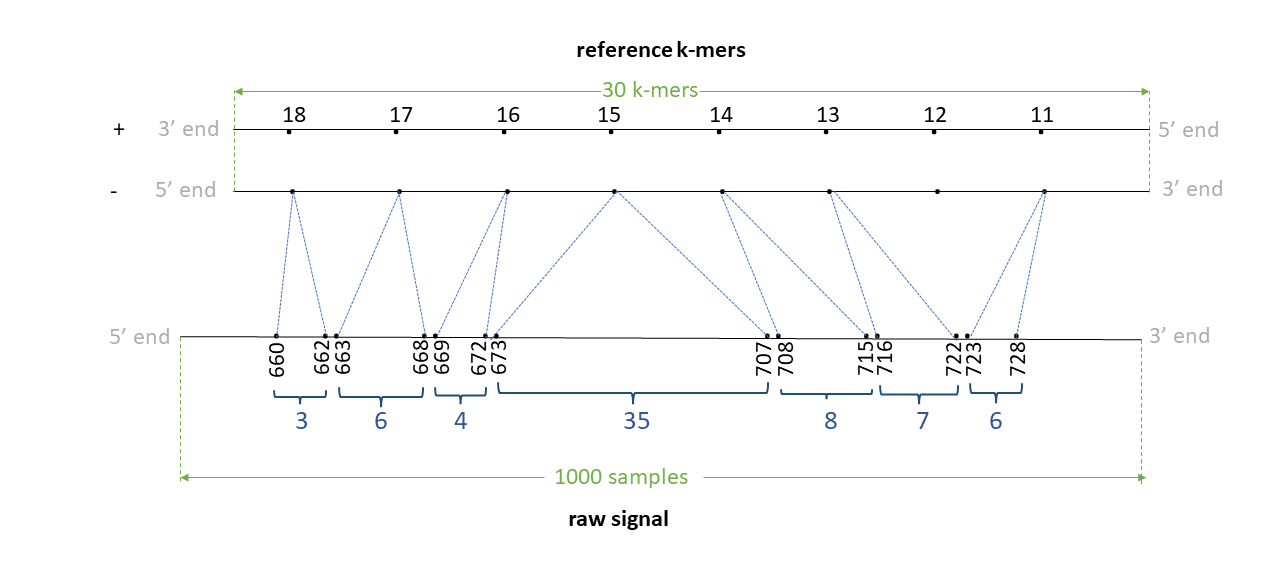
Assume that the 11-24th bases (0-index; bed-like) in this contig are ATTGATGGTGGAA. Thus, 11th kmer is ATTGAT, 12th k-mer is TTGATG, 13th k-mer is TGATGG, .. 17th k-mer is GGTGGA and the 18th k-mer is GTGGAA.
Th negative strand is like:
5' ATTGATGGTGGAA 3' + strand
   |||||||||||||
3' TAACTACCACCTT 5' - strand
The Reverse complement is thus TTCCACCATCAAT. The 11th k-mer ATTGAT in the + strand relates to ATCAAT in the - strand, 12th k-mer TTGATG relates to CATCAA, 13th k-mer TGATGG relates to CCATC ,… , 17th k-mer GGTGGA relates to TCCACC and 18th k-mer GTGGAA relates to TTCCAC.
The TSV output from resquiggle will look like below (assume --print-read-name and --signal-index are provided):
| contig | position | reference_kmer | read_id | strand | event_index | event_level_mean | event_stdv | event_length | model_kmer | model_mean | model_stdv | standardized_level | start_idx | end_idx |
|---|---|---|---|---|---|---|---|---|---|---|---|---|---|---|
| ctg0 | 11 | ATTGAT | rid1 | t | 216 | 80.09 | 0.969 | 0.00150 | NNNNNN | 0.00 | 0.00 | inf | 723 | 729 |
| ctg0 | 13 | TGATGG | rid1 | t | 215 | 78.14 | 0.577 | 0.00100 | CCATCA | 75.83 | 2.68 | 0.79 | 719 | 723 |
| ctg0 | 13 | TGATGG | rid1 | t | 214 | 74.39 | 1.898 | 0.00075 | CCATCA | 75.83 | 2.68 | -0.49 | 716 | 719 |
| ctg0 | 14 | GATGGT | rid1 | t | 213 | 86.91 | 2.630 | 0.00200 | ACCATC | 86.41 | 2.16 | 0.21 | 708 | 716 |
| ctg0 | 15 | ATGGTG | rid1 | t | 212 | 93.88 | 1.184 | 0.00150 | CACCAT | 97.64 | 2.26 | -1.52 | 702 | 708 |
| ctg0 | 15 | ATGGTG | rid1 | t | 211 | 99.83 | 1.552 | 0.00125 | CACCAT | 97.64 | 2.26 | 0.88 | 697 | 702 |
| ctg0 | 15 | ATGGTG | rid1 | t | 210 | 98.60 | 0.511 | 0.00075 | CACCAT | 97.64 | 2.26 | 0.39 | 694 | 697 |
| ctg0 | 15 | ATGGTG | rid1 | t | 209 | 99.54 | 1.254 | 0.00225 | CACCAT | 97.64 | 2.26 | 0.77 | 685 | 694 |
| ctg0 | 15 | ATGGTG | rid1 | t | 208 | 97.82 | 1.226 | 0.00075 | CACCAT | 97.64 | 2.26 | 0.07 | 682 | 685 |
| ctg0 | 15 | ATGGTG | rid1 | t | 207 | 99.46 | 0.562 | 0.00100 | CACCAT | 97.64 | 2.26 | 0.73 | 678 | 682 |
| ctg0 | 15 | ATGGTG | rid1 | t | 206 | 98.85 | 0.916 | 0.00125 | CACCAT | 97.64 | 2.26 | 0.49 | 673 | 678 |
| ctg0 | 16 | TGGTGG | rid1 | t | 205 | 86.25 | 1.327 | 0.00100 | CCACCA | 85.37 | 1.55 | 0.52 | 669 | 673 |
| ctg0 | 17 | GGTGGA | rid1 | t | 204 | 86.88 | 1.283 | 0.00075 | TCCACC | 87.17 | 1.76 | -0.15 | 666 | 669 |
| ctg0 | 17 | GGTGGA | rid1 | t | 203 | 85.62 | 0.589 | 0.00075 | TCCACC | 87.17 | 1.76 | -0.81 | 663 | 666 |
| ctg0 | 18 | GTGGAA | rid1 | t | 202 | 90.79 | 1.335 | 0.00075 | TTCCAC | 91.76 | 1.96 | -0.45 | 660 | 663 |
The PAF output from eventalign will look like below (the header is not present in the actual output):
| read_id | len_raw_signal | start_raw | end_raw | strand | ref_id | len_kmer | start_kmer | end_kmer | matches | len_block | mapq | |
|---|---|---|---|---|---|---|---|---|---|---|---|---|
| rid1 | 1000 | 660 | 729 | - | ctg0 | 30 | 11 | 19 | 7 | 8 | 255 | ss:Z:3,6,4,35,8,7,1D6, |
RNA examples
Positive strand
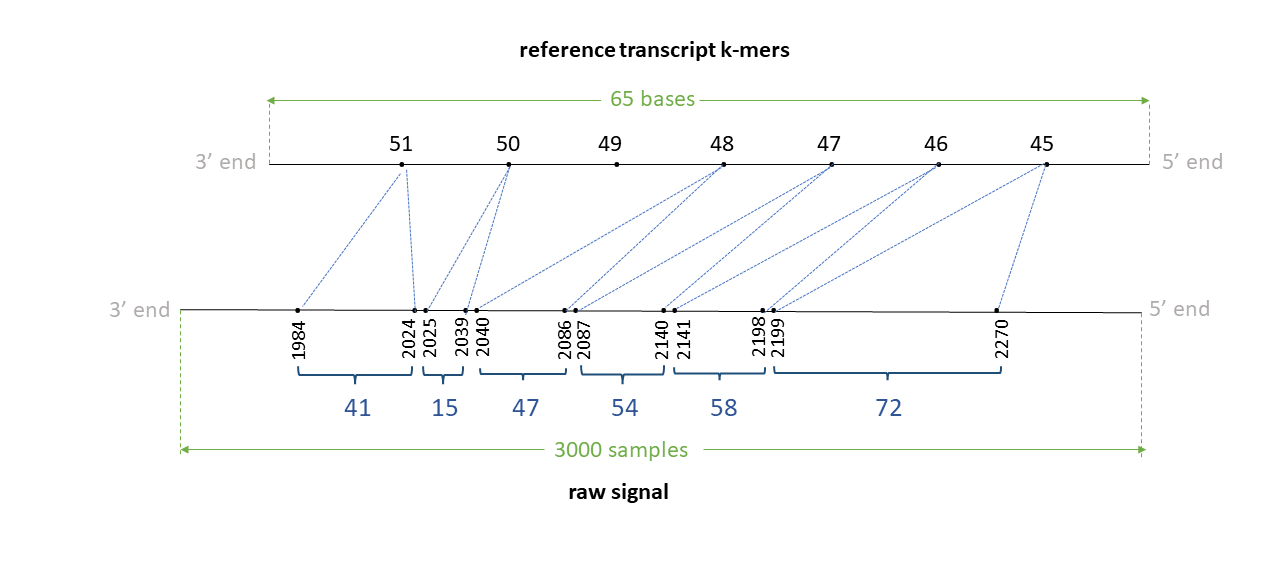
Assume we have a read signal named rid0 of 3000 signal samples, mapped to a reference transcript (or can be a ctg in the reference genome) named trn0 of 65 bases. Assume a k-mer size of 5. We have a total of 61 k-mers in the reference.
Assume the signal-reference alignment looks like in the figure below. Note that the RNA is sequenced 3’->5’ end, so the raw signal is 3’->5’ direction. However, as transcipts in the reference are in 5’->3’ direction, the transcript is reversed to be 3’->5’ in the illustration (note: indices in illustration denote the actual index in the transcriptd in 5’->3’ direction).
Assume that the 45-56th bases (0-index; bed-like) in this transcript in 5’->3’ direction is GAGAGCCCTGA. Then, 45th kmer is GAGAG, 46th k-mer is AGAGC, 47th k-mer is GAGCC, .. and the 51st k-mer is CCTGA.
The TSV output from resquiggle will look like below (assume --print-read-name and --signal-index are provided):
| contig | position | reference_kmer | read_id | strand | event_index | event_level_mean | event_stdv | event_length | model_kmer | model_mean | model_stdv | standardized_level | start_idx | end_idx |
|---|---|---|---|---|---|---|---|---|---|---|---|---|---|---|
| trn0 | 45 | GAGAG | rid0 | t | 62 | 139.24 | 11.306 | 0.02390 | GAGAG | 140.16 | 10.24 | -0.07 | 2199 | 2271 |
| trn0 | 46 | AGAGC | rid0 | t | 63 | 141.04 | 11.203 | 0.01926 | AGAGC | 144.32 | 9.93 | -0.25 | 2141 | 2199 |
| trn0 | 47 | GAGCC | rid0 | t | 64 | 117.06 | 5.038 | 0.01029 | GAGCC | 118.37 | 5.26 | -0.19 | 2110 | 2141 |
| trn0 | 47 | GAGCC | rid0 | t | 65 | 114.03 | 1.993 | 0.00365 | GAGCC | 118.37 | 5.26 | -0.62 | 2099 | 2110 |
| trn0 | 47 | GAGCC | rid0 | t | 66 | 116.30 | 3.843 | 0.00398 | GAGCC | 118.37 | 5.26 | -0.30 | 2087 | 2099 |
| trn0 | 48 | AGCCC | rid0 | t | 67 | 132.00 | 1.294 | 0.00697 | AGCCC | 126.60 | 5.74 | 0.71 | 2066 | 2087 |
| trn0 | 48 | AGCCC | rid0 | t | 68 | 93.27 | 13.847 | 0.00863 | NNNNN | 0.00 | 0.00 | inf | 2040 | 2066 |
| trn0 | 50 | CCCTG | rid0 | t | 69 | 80.59 | 2.676 | 0.00498 | CCCTG | 86.42 | 4.10 | -1.08 | 2025 | 2040 |
| trn0 | 51 | CCTGA | rid0 | t | 70 | 100.31 | 2.563 | 0.00398 | CCTGA | 109.18 | 4.97 | -1.35 | 2013 | 2025 |
| trn0 | 51 | CCTGA | rid0 | t | 71 | 116.03 | 2.440 | 0.00631 | CCTGA | 109.18 | 4.97 | 1.04 | 1994 | 2013 |
| trn0 | 51 | CCTGA | rid0 | t | 72 | 101.67 | 1.433 | 0.00332 | CCTGA | 109.18 | 4.97 | -1.14 | 1984 | 1994 |
The PAF output from eventalign will look like below (the header is not present in the actual output):
| read_id | len_raw_signal | start_raw | end_raw | strand | ref_id | len_kmer | start_kmer | end_kmer | matches | len_block | mapq | |
|---|---|---|---|---|---|---|---|---|---|---|---|---|
| rid0 | 3000 | 1984 | 2271 | + | trn0 | 61 | 52 | 45 | 6 | 7 | 255 | ss:Z:41,15,1D47,54,58,72, |
Note that start_kmer and end_kmer are otherway round compared to DNA.
Negative strand
Assume we have a read signal named rid1 of 500 signal samples, mapped to a reference contig named ctg1 of 20 bases. Assume a k-mer size of 5. We have a total of 24 k-mers in the reference. Assume the signal-reference alignment looks like in the figure below (note: indices in illustration denote the actual index in the + strand of the reference genome in 5’->3’ direction).
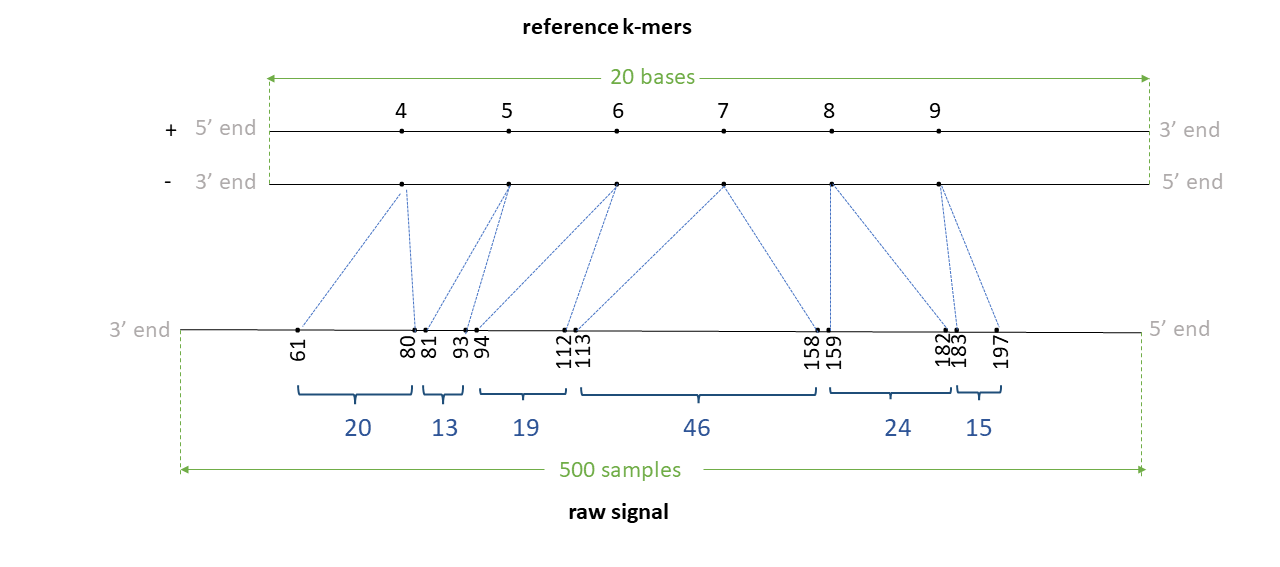
Assume that the 4-13th bases (0-index; bed-like) in this contig are AAATGGCTGA. Thus, 4th kmer is AAATG, 5th k-mer is AATGG, .. 8th k-mer is GGCTG and the 9th k-mer is GCTGA.
Th negative strand is like:
5' AAATGGCTGA 3' + strand
   ||||||||||
3' TTTACCGACT 5' - strand
The Reverse complement is thus TCAGCCATTT. The 4th k-mer AAATG in the + strand relates to CATTT in the - strand, 5th k-mer AATGG relates to CCATT ,… , 8th k-mer GGCTG relates to CAGCC and 9th k-mer GCTGA relates to TCAGC.
The TSV output from resquiggle will look like below (assume --print-read-name and --signal-index are provided):
| contig | position | reference_kmer | read_id | strand | event_index | event_level_mean | event_stdv | event_length | model_kmer | model_mean | model_stdv | standardized_level | start_idx | end_idx |
|---|---|---|---|---|---|---|---|---|---|---|---|---|---|---|
| ctg1 | 4 | AAATG | rid1 | t | 14 | 100.70 | 2.678 | 0.00664 | CATTT | 100.40 | 6.94 | 0.04 | 61 | 81 |
| ctg1 | 5 | AATGG | rid1 | t | 13 | 96.55 | 4.060 | 0.00432 | CCATT | 98.42 | 2.68 | -0.62 | 81 | 94 |
| ctg1 | 6 | ATGGC | rid1 | t | 12 | 83.36 | 1.416 | 0.00332 | GCCAT | 84.06 | 2.64 | -0.24 | 94 | 104 |
| ctg1 | 6 | ATGGC | rid1 | t | 11 | 87.00 | 6.172 | 0.00299 | GCCAT | 84.06 | 2.64 | 0.99 | 104 | 113 |
| ctg1 | 7 | TGGCT | rid1 | t | 10 | 121.45 | 4.970 | 0.00598 | AGCCA | 121.42 | 4.13 | 0.01 | 113 | 131 |
| ctg1 | 7 | TGGCT | rid1 | t | 9 | 128.10 | 1.094 | 0.00299 | AGCCA | 121.42 | 4.13 | 1.44 | 131 | 140 |
| ctg1 | 7 | TGGCT | rid1 | t | 8 | 124.88 | 4.039 | 0.00631 | AGCCA | 121.42 | 4.13 | 0.75 | 140 | 159 |
| ctg1 | 8 | GGCTG | rid1 | t | 7 | 115.80 | 2.588 | 0.00465 | CAGCC | 115.81 | 3.78 | -0.00 | 159 | 173 |
| ctg1 | 8 | GGCTG | rid1 | t | 6 | 111.04 | 2.482 | 0.00332 | CAGCC | 115.81 | 3.78 | -1.13 | 173 | 183 |
| ctg1 | 9 | GCTGA | rid1 | t | 5 | 99.95 | 2.843 | 0.00498 | TCAGC | 101.66 | 6.39 | -0.24 | 183 | 198 |
The PAF output from eventalign will look like below (the header is not present in the actual output):
| read_id | len_raw_signal | start_raw | end_raw | strand | ref_id | len_kmer | start_kmer | end_kmer | matches | len_block | mapq | |
|---|---|---|---|---|---|---|---|---|---|---|---|---|
| rid1 | 500 | 61 | 198 | - | ctg1 | 24 | 10 | 4 | 6 | 6 | 255 | ss:Z:20,13,19,46,24,15, |
eventalign SAM output
Specifying -a will generate the output in SAM format (much smaller than the TSV output, f5c v1.3 or higher). This output SAM file will contain the following two additional tags added to the S/BAM file given as the input to f5c:
| Tag | Type | Description |
|---|---|---|
| si | Z | coordinates associated with the ss tag below (explained below) |
| ss | Z | signal alignment string in format described under here |
si tag contains four comma separated values start_raw, end_raw, start_kmer and end_kmer, respectively. Those values have the same as the columns 3,4,8 and 9 in the PAF format explained above when specified along with -c.
call-methylation
Same as Nanopolish output.